
Macro Trading Dashboard: What It Is, And Why Every Serious Trader Needs One.
Hedge funds don't enter a trade without checking the macro environment first.
Retail traders mostly do.
A macro trading dashboard closes that gap.
Here's everything you need to know.
Contents
What is a macro trading dashboard?
Why retail traders need one
What to look for in a macro dashboard
The best macro trading dashboards in 2026
How to use a macro dashboard before every trade
Frequently asked questions
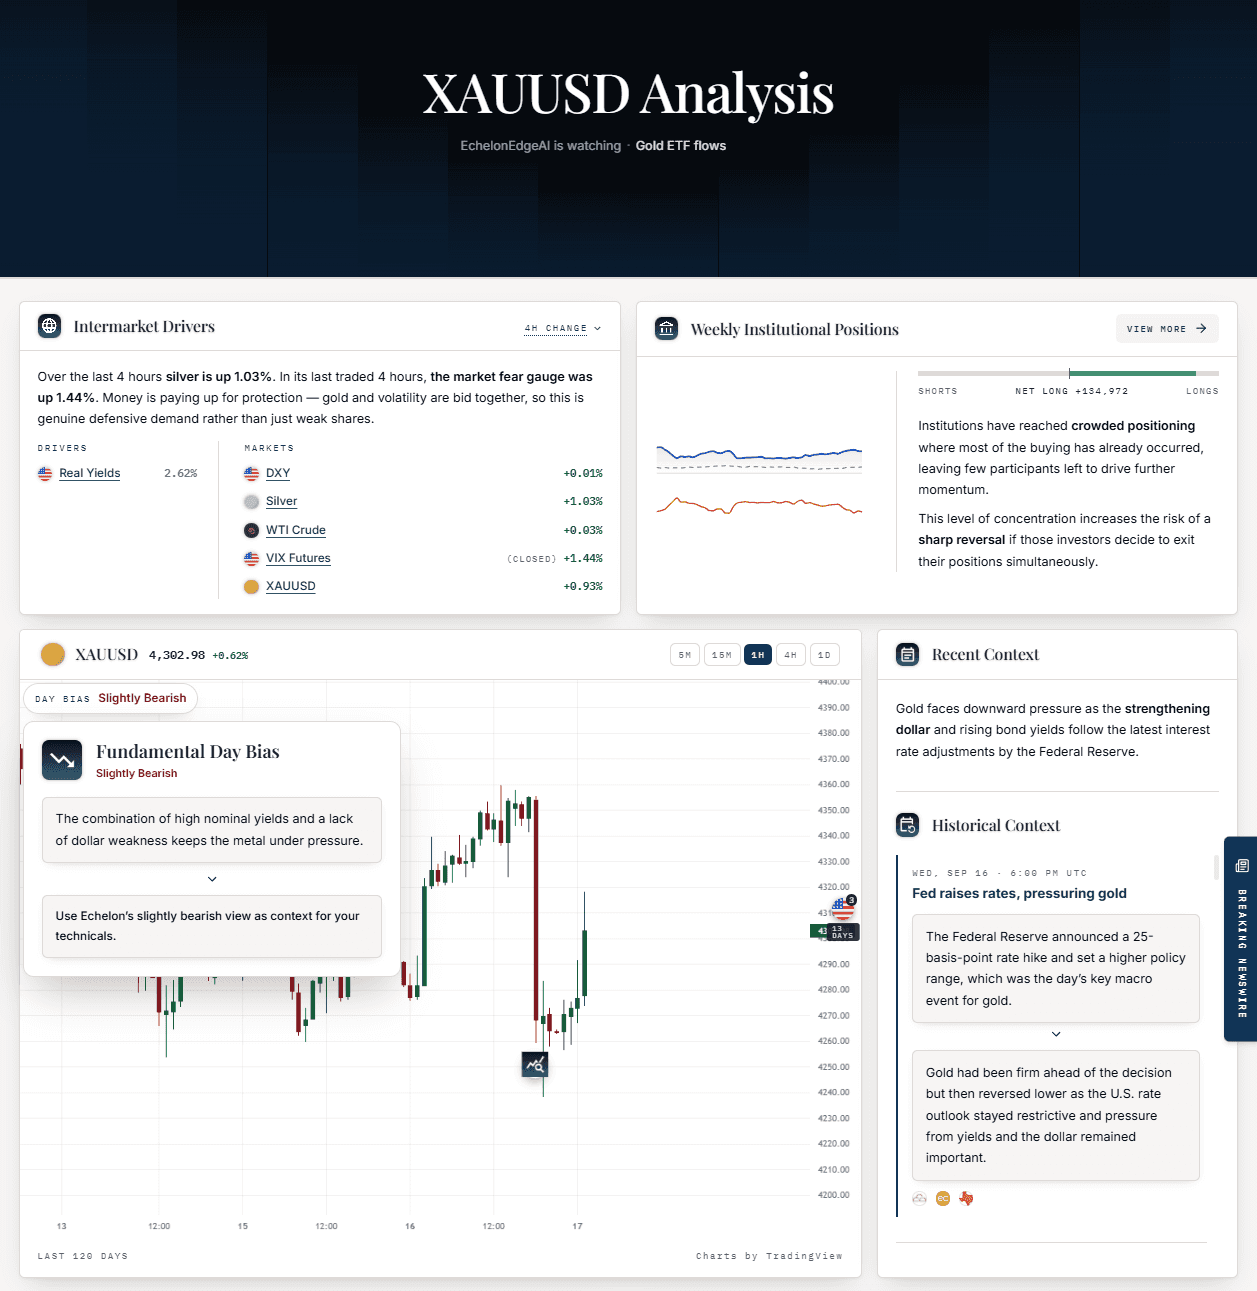
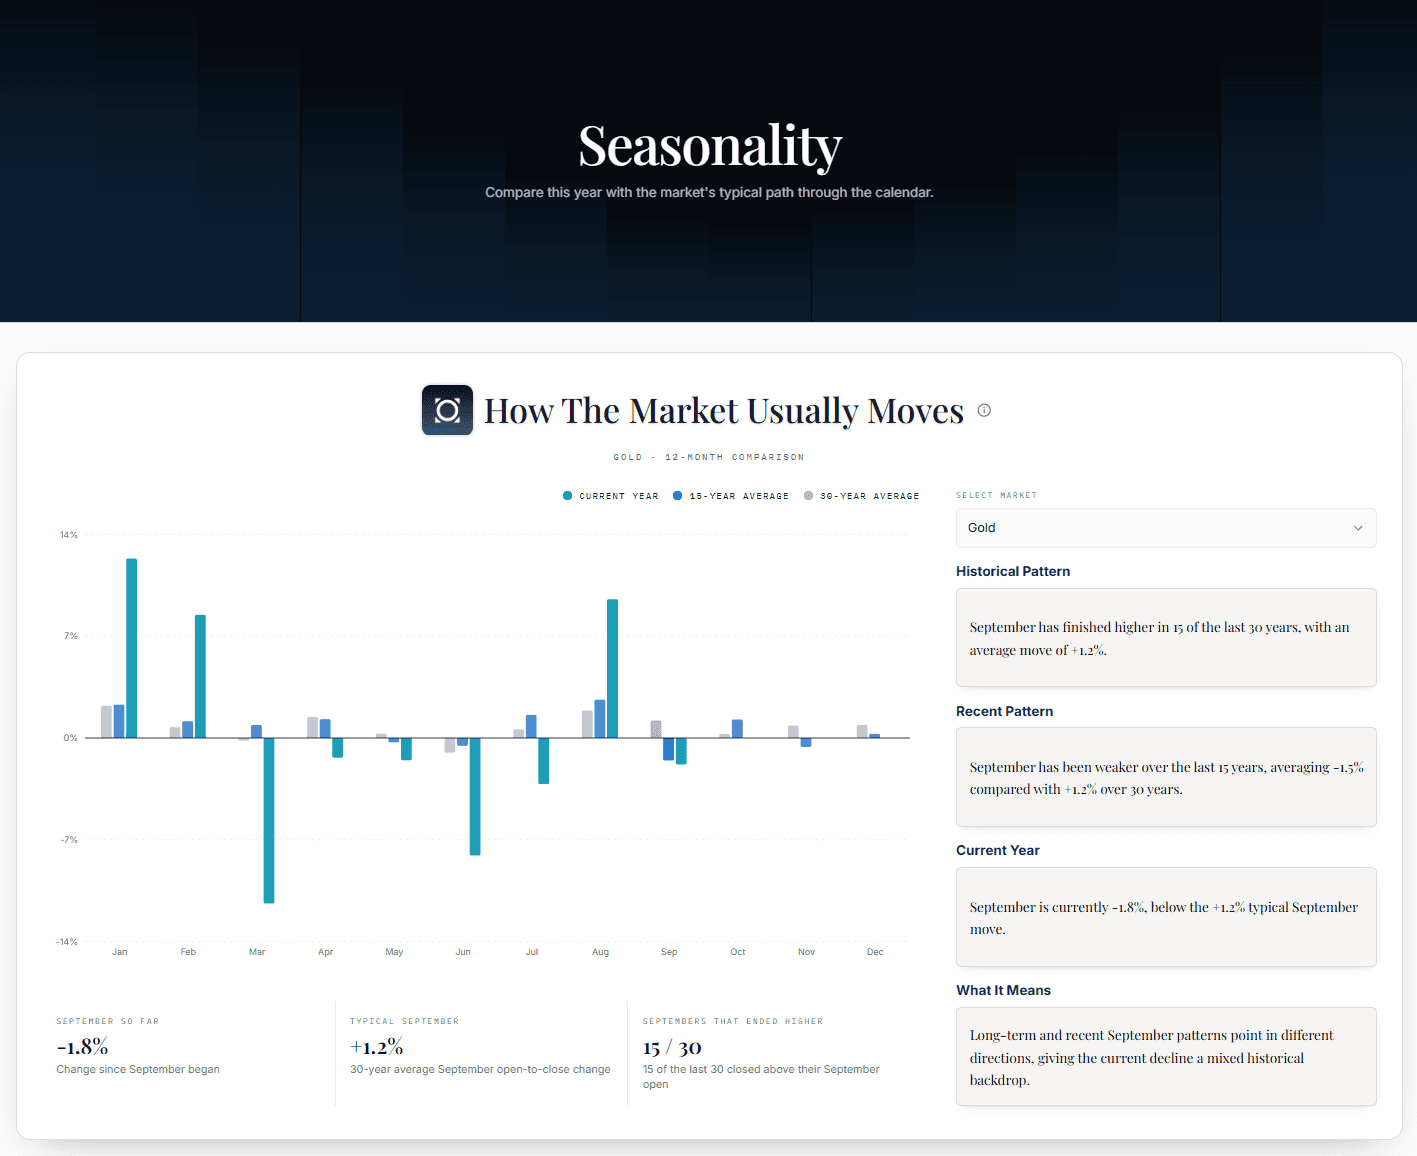
What Is a Macro Trading Dashboard?
A macro trading dashboard is a centralised tool that aggregates and interprets the macroeconomic conditions influencing a financial asset — in real time, before you enter a trade.
Where a standard trading platform shows you price action, a macro dashboard shows you why price is moving. It pulls together the inputs that institutional desks monitor constantly: central bank policy direction, economic data releases, yield differentials, risk sentiment, COT (Commitment of Traders) positioning, and cross-market flows — then filters all of that to the specific asset you're about to trade.
The result is pre-trade context that your chart alone can never provide.
The Core Problem
A chart tells you what price has done. A macro dashboard tells you why it did it — and what conditions are set up for the next move. Most retail traders only have access to half of that picture.
Macro vs Technical Analysis
Technical analysis and macro analysis are not competitors — they're two layers of the same decision. Your technical setup identifies a potential entry. Your macro environment tells you whether the structural conditions support or oppose that entry. One without the other leaves a significant blind spot.
The most common scenario: a technically perfect setup — clean structure, confluence, momentum — runs directly into a central bank announcement or economic release that reverses price in seconds. A macro dashboard would have shown that event was on the calendar and that conditions were misaligned before the trade was placed.
Why Retail Traders Need a Macro Dashboard
Institutional trading desks — banks, hedge funds, prop firms — employ macro analysts whose sole job is to interpret the economic environment before every position is taken. They have access to premium data terminals, analyst reports, and real-time feeds from multiple sources simultaneously.
Retail traders have historically had none of that. They either spend hours manually aggregating information from FRED, ForexFactory, Reuters, and the CFTC — or they skip the step entirely and trade purely on technicals, hoping macro doesn't intervene.
This is the information asymmetry that institutional traders exploit every single session.
A macro trading dashboard doesn't eliminate that gap — nothing does. But it compresses the time and complexity involved in getting a macro read down to something a retail trader can actually do before every trade, without a research team behind them.
Real scenario
You see a clean bullish setup on GBPUSD. Your structure is solid, your confluence is there. What your chart doesn't show: the Bank of England has signalled a dovish pivot, UK CPI printed below expectations this week, and COT data shows commercial traders are net short sterling at multi-year extremes. Your bullish setup exists inside a fundamentally bearish macro environment. A macro dashboard surfaces all of that in under a minute.
What to Look For in a Macro Trading Dashboard
Not every tool marketed as a "macro dashboard" actually delivers institutional-grade intelligence. Here are the components that matter:
1. Asset-Specific Filtering
The dashboard should filter macro data to the specific asset you're trading — not dump a wall of global information and leave you to sort it out. If you're trading EURUSD, you need ECB and Fed data. If you're trading gold, you need dollar direction, real yields, and risk sentiment. Generic macro feeds are noise; asset-filtered intelligence is signal.
2. Live Economic Data Integration
Economic releases move markets the moment they print. Your dashboard needs to surface data from primary sources — ideally FRED, BLS, BEA, EIA — and flag which releases are relevant to your asset, rather than requiring you to cross-reference ForexFactory manually.
3. COT (Commitment of Traders) Positioning
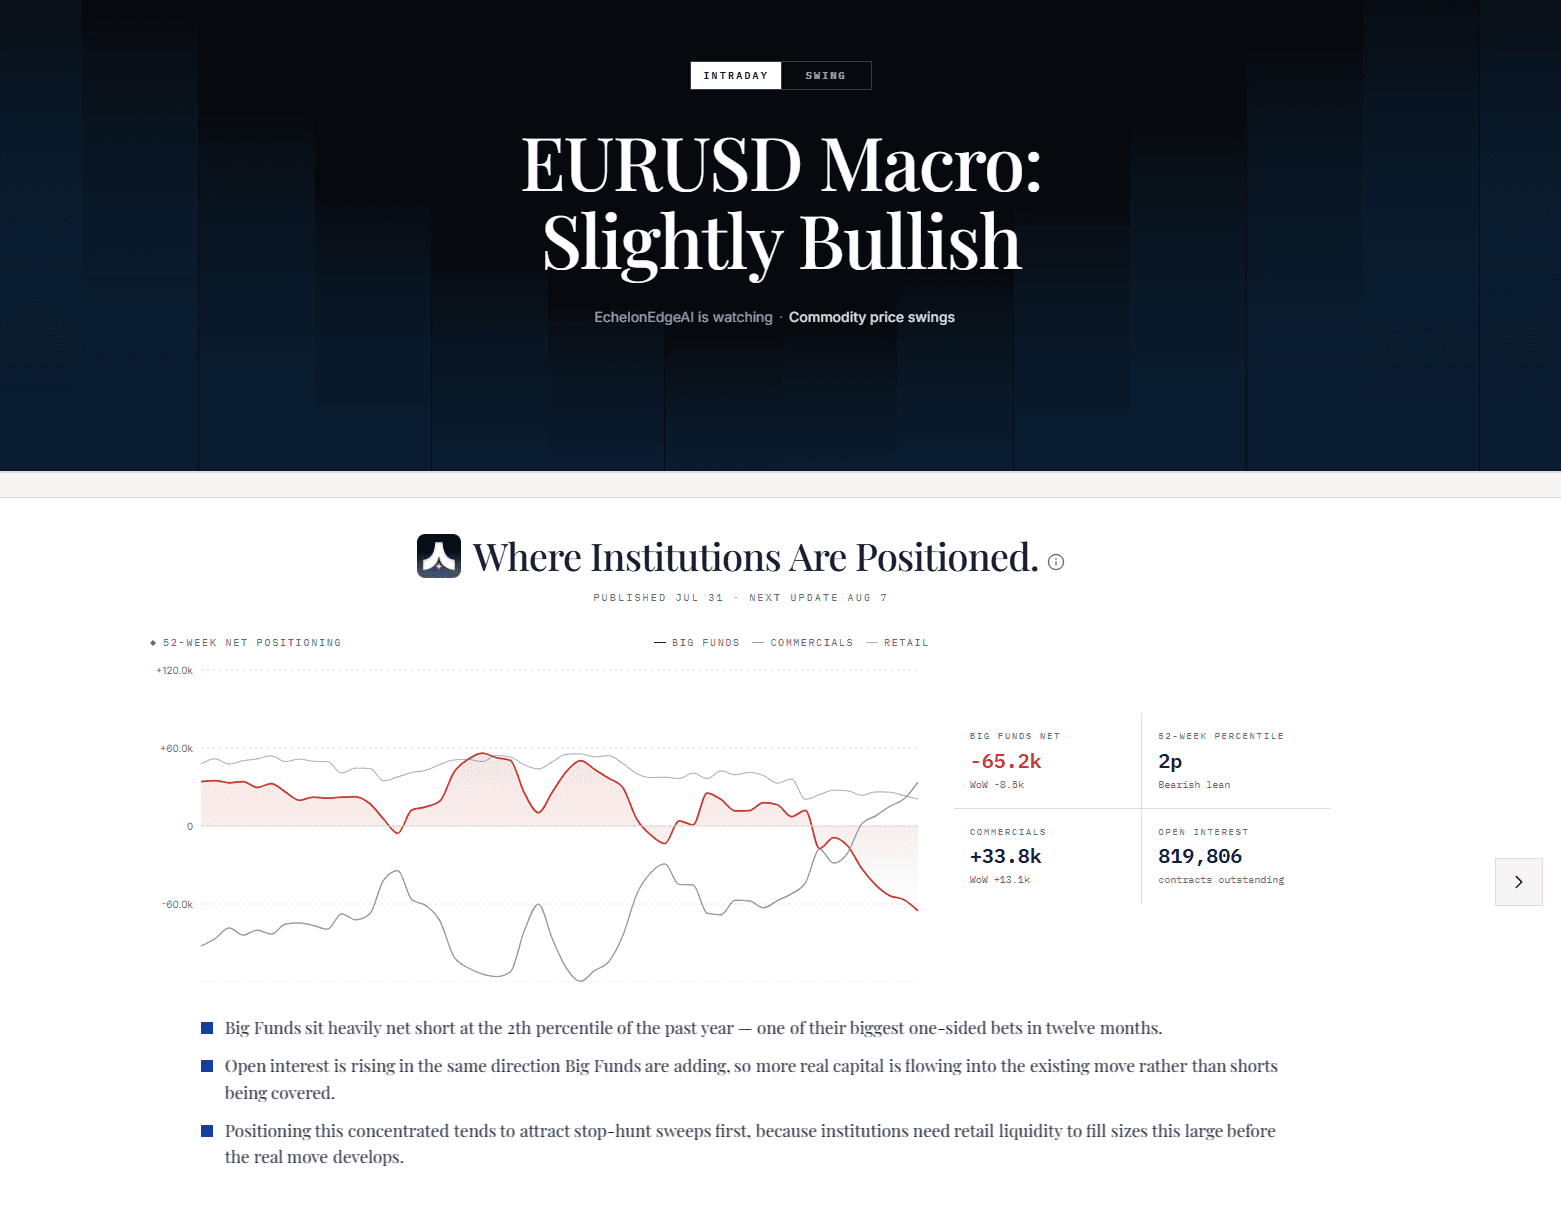
CFTC COT data shows how institutional participants — commercial hedgers, large speculators, small speculators — are positioned across major currency pairs, commodities and indices. Extreme positioning readings are one of the most reliable contrarian signals in macro trading. Any serious macro dashboard should integrate this data and make it readable without a statistics degree.
4. AI-Interpreted Bias
Raw data is valuable. Interpreted data is actionable. The best modern macro dashboards use AI to synthesise conditions across multiple inputs and output a directional bias for the asset — bullish, bearish, or neutral — along with the supporting and resisting factors. This doesn't replace your analysis; it gives you a structured starting point.
5. Institutional News Feed
Not social media sentiment. Not retail trading Twitter. Actual market-moving news from institutional sources — central bank statements, economic reports, geopolitical developments — filtered to what's relevant to your asset and updated continuously throughout the session.
6. Pre-Trade Flow Integration
The most effective macro dashboards don't just show information — they guide you through a structured pre-trade process: check the macro environment, confirm your bias, review positioning, then decide whether to enter. This structure is what converts macro information from interesting to actually useful.
The Best Macro Trading Dashboards in 2026
The market for macro intelligence tools has grown significantly in the past two years as retail traders become more sophisticated. Here's an honest comparison of the main options currently available:
EchelonEdgeAI
Built specifically as a pre-trade macro intelligence dashboard for retail forex and multi-asset traders. Selects your asset, then loads live institutional news, AI-generated directional bias, COT positioning data, and a structured Plan a Trade flow — all filtered to that asset in one screen. Data sourced from FRED, BLS, BEA, EIA and institutional global news feeds.

Strengths
Asset-specific filtering across forex, indices, gold, oil, crypto, equities
AI bias interpretation with supporting and resisting factors
Structured Plan a Trade pre-entry flow
COT data integrated and readable
Paid subscription from $29/month
Limitations
No mobile app yet
TradingView (Freemium)
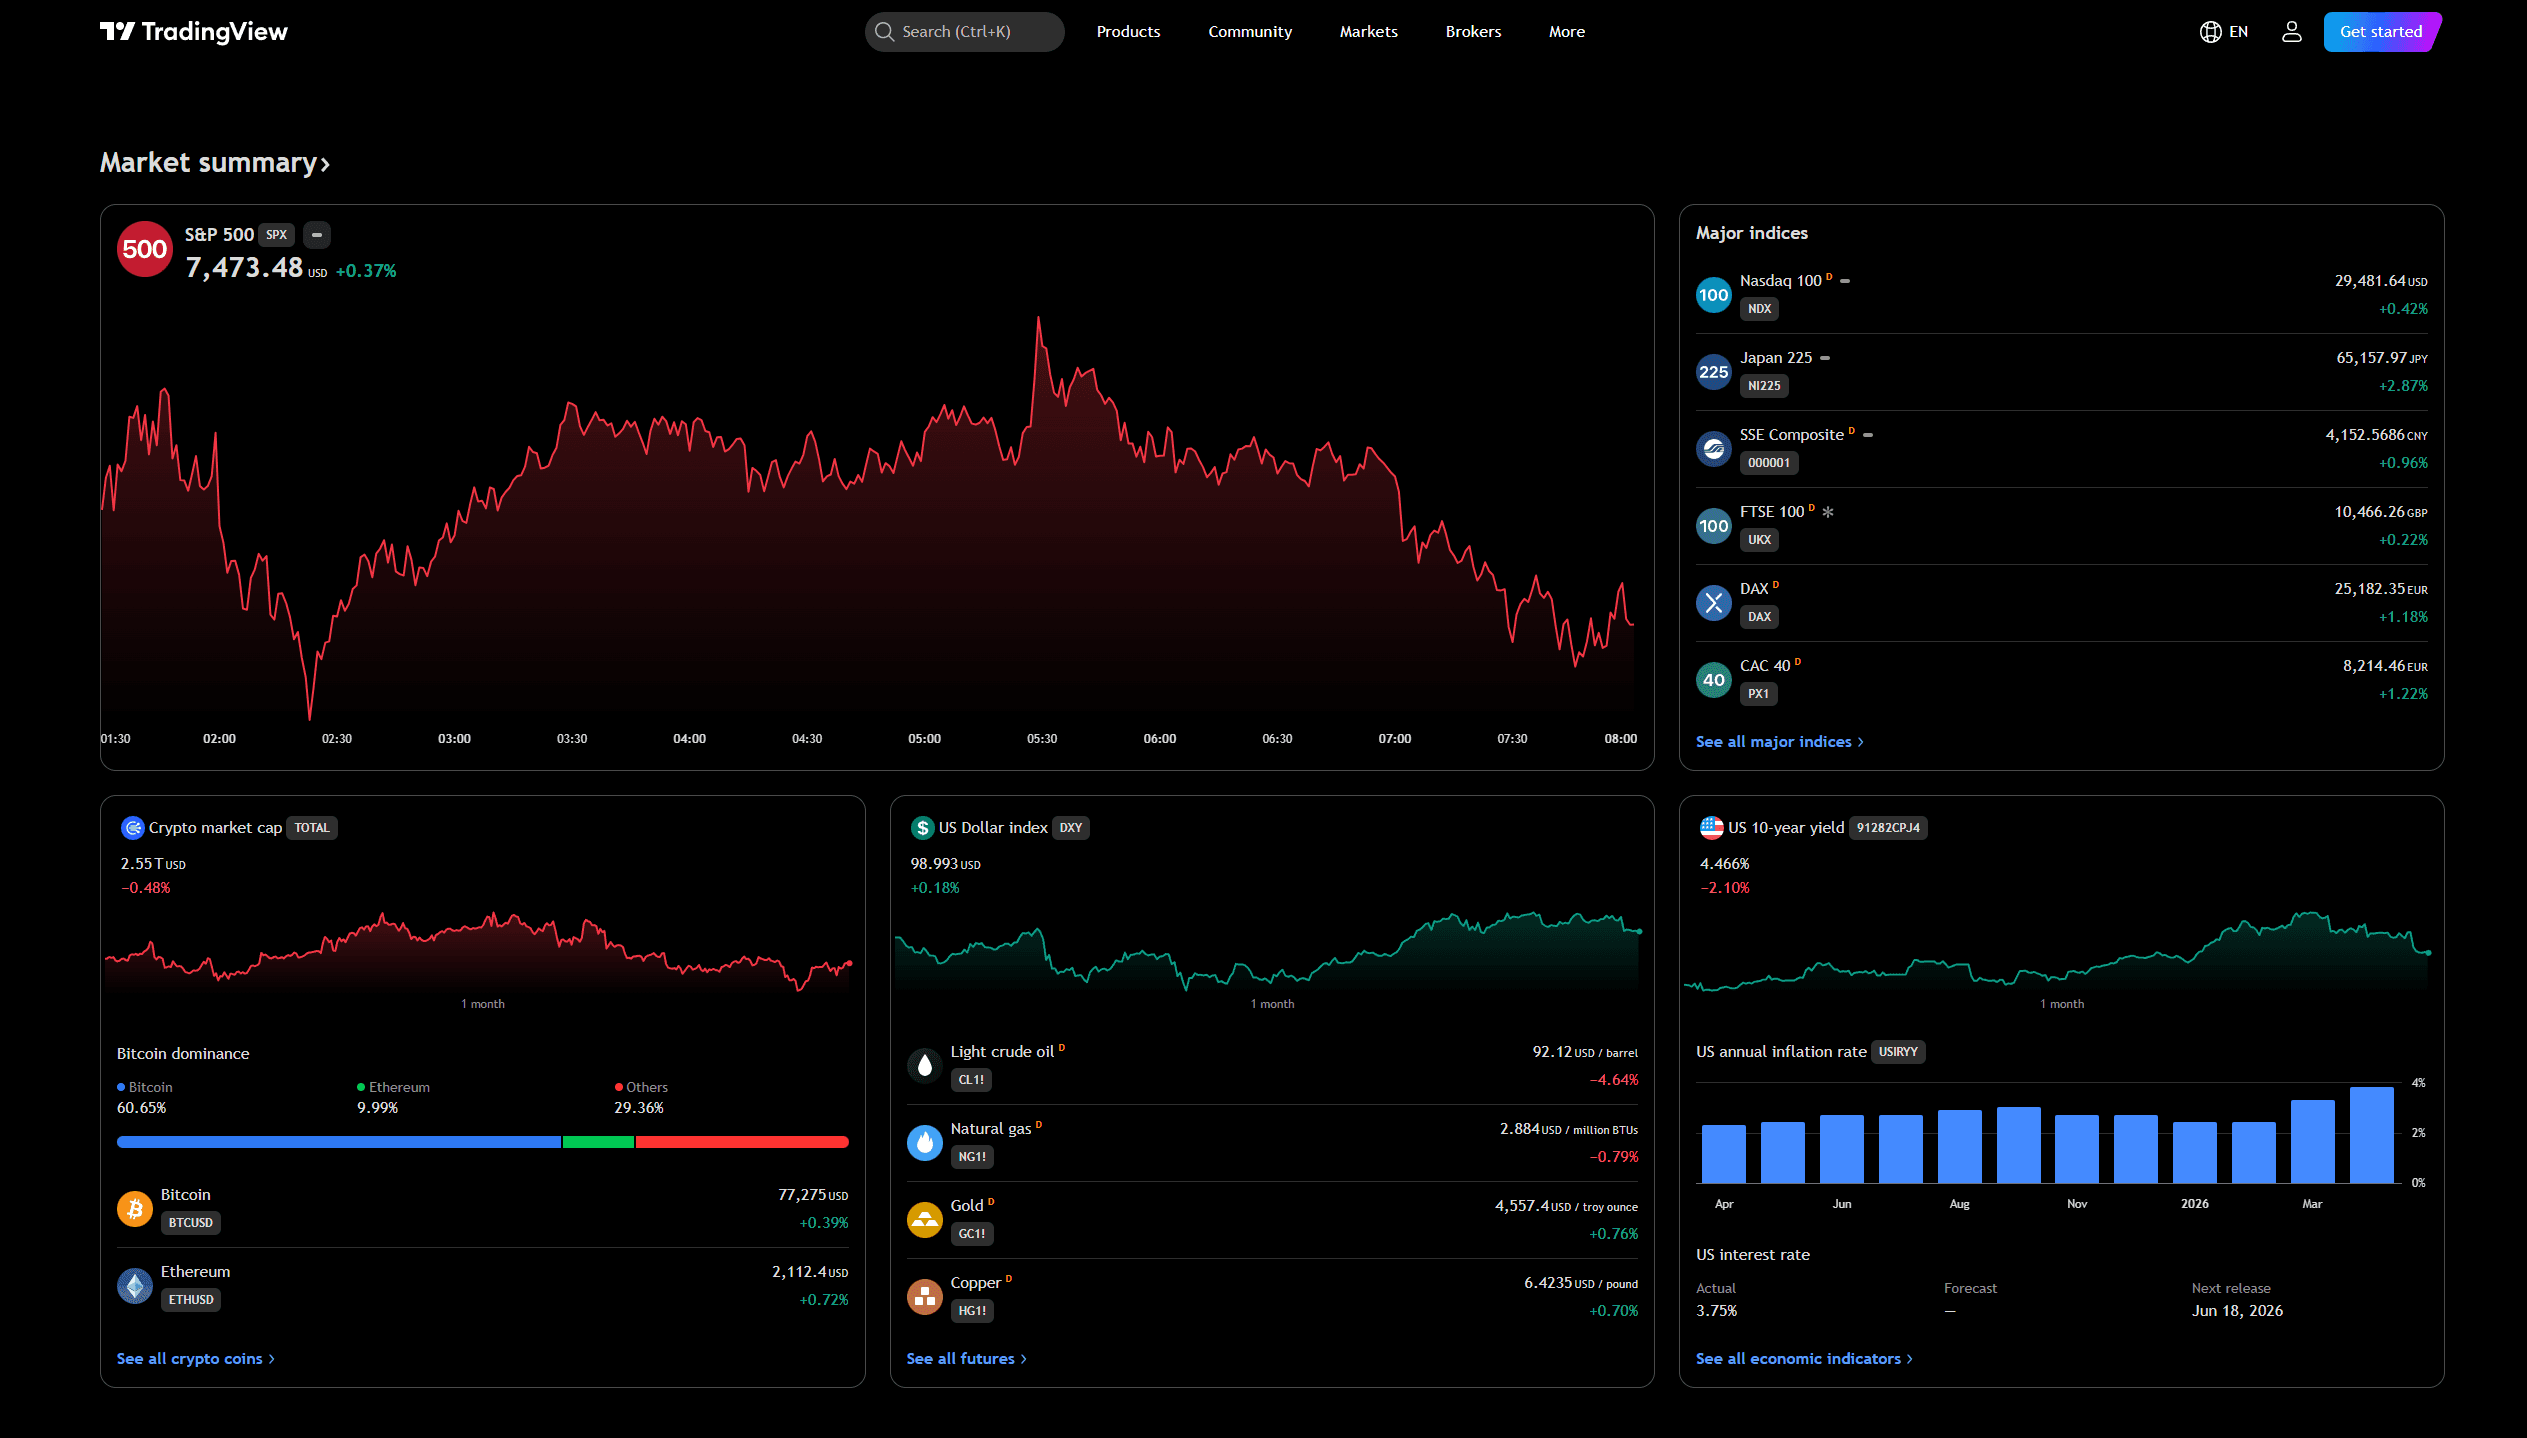
The industry standard for charting. TradingView has expanded into macro data and economic calendars, but remains primarily a technical analysis platform. Macro data is available but requires manual aggregation and interpretation — it doesn't synthesise conditions into an actionable bias.
Strengths
Best-in-class charting
Large community and script library
Economic calendar built in
Limitations
No AI-interpreted macro bias
No COT integration
Macro data requires manual interpretation
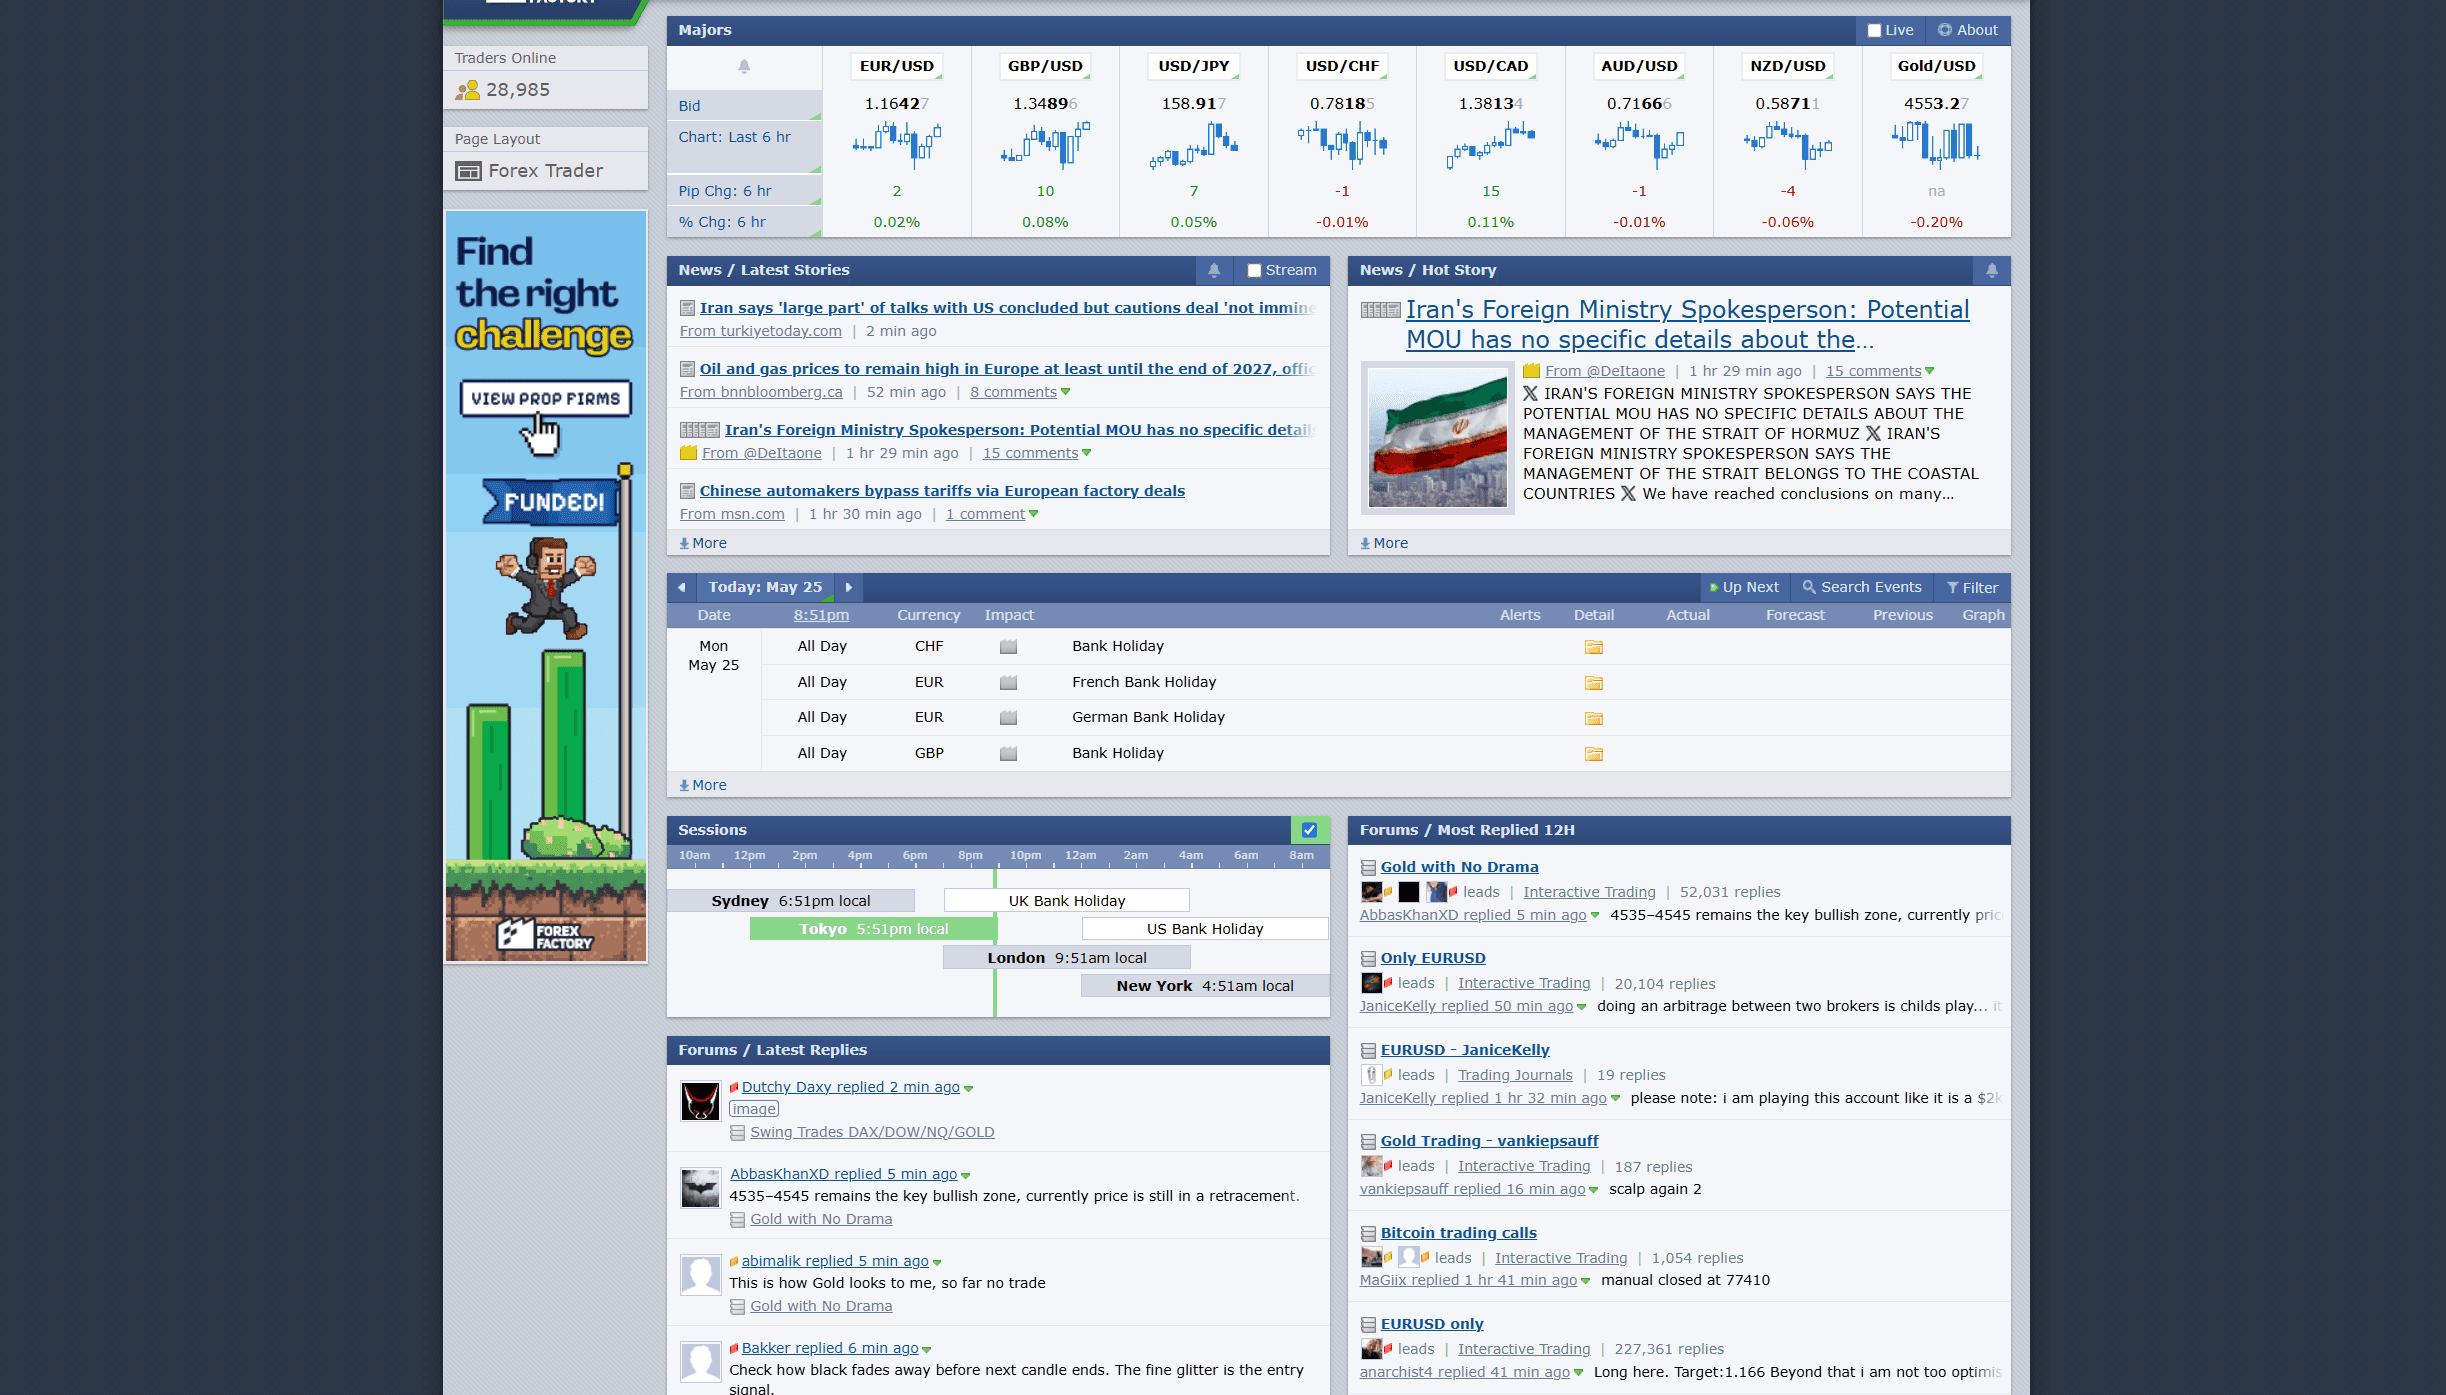
ForexFactory (Free)
The most widely used economic calendar in retail forex trading. Excellent for tracking scheduled economic releases and reading community sentiment. Not a macro dashboard — it surfaces events but doesn't interpret what those events mean for a specific asset.
Strengths
Comprehensive economic calendar
Free with no paywall
Large community discussion threads
Limitations
No macro interpretation or bias
No COT data
No asset-specific filtering
How to Use a Macro Dashboard Before Every Trade
Having access to a macro dashboard is one thing. Integrating it into your actual trading process is another. Here's the pre-trade flow that serious traders use:
Step 1 — Select your asset and check the bias
Before you look at your chart, open your macro dashboard and select the asset you're considering. Check the current directional bias and note the supporting and resisting factors. This takes 30 seconds and immediately tells you whether your intended direction has macro wind behind it or against it.

Step 2 — Check the news feed for this session
What institutional news has printed today that affects this asset? A central bank statement, an economic data release, a geopolitical development? Your macro dashboard should surface this filtered to your asset — not require you to scan Reuters manually.

Step 3 — Review COT positioning
Where are institutional players positioned? Extreme COT readings in the direction you're planning to trade are confirmation. Extreme readings against your direction are a warning. This doesn't mean you don't take the trade — it means you understand the full context.

Step 4 — Plan the trade with macro context active
Now open your chart. With the macro environment clear in your mind, assess your technical setup against that backdrop. Does your bullish structure exist inside a bullish macro environment? Does your short setup have fundamental backing? The confluence of technical and macro is where high-probability trades live.
Step 5 — Log your reasoning
The best macro dashboards include a pre-trade journal component where you record why you're entering — technical setup, macro alignment, COT positioning. This creates accountability and, over time, the data you need to identify which macro setups have the highest hit rate for your trading style.
The Macro Dashboard Built for This Exact Flow
EchelonEdgeAI is built around one simple workflow: select the asset, understand what has been driving it, see what is driving it now, and understand what could matter next.
The platform brings together:
Macro conditions
Institutional positioning
Market developments and historical context
Breaking news
Economic events and scenario context
Relevant cross-market drivers
Trading sessions and journaling
Instead of opening multiple dashboards and manually connecting the information, EchelonEdgeAI organizes the context around the market you're actually watching.
It is designed to help you understand the market before you trade it, not to replace your judgement with a signal.
Plans start at $29/month, with annual billing available.
Frequently Asked Questions
What is the difference between a macro trading dashboard and an economic calendar?
An economic calendar tells you when data releases are scheduled and shows the result when they print. A macro trading dashboard goes further — it interprets what those releases mean for a specific asset you're trading, synthesises conditions across multiple inputs, and produces an actionable directional bias. An economic calendar is raw data; a macro dashboard is interpreted intelligence.
Do I need macro experience to use a macro trading dashboard?
No. The best macro dashboards are designed to interpret macro conditions and present them in plain English — directional bias, supporting factors, resisting factors. You don't need to understand the mechanics of yield curve dynamics to use the output. The system does the interpretation; you use the result to confirm or challenge your technical view.
What assets does a macro trading dashboard typically cover?
Coverage varies by tool. EchelonEdgeAI covers forex majors and crosses, gold, oil, major global indices, crypto and equities. The key is that macro conditions are meaningfully different for each asset class — a dollar-bullish macro environment affects EURUSD very differently from how it affects XAUUSD, so asset-specific filtering is essential.
Is macro analysis useful for day traders or only swing traders?
Both. Day traders benefit from knowing which macro events are scheduled during the session, what the current institutional bias is, and whether the broader environment supports or opposes intraday momentum. Swing traders use macro conditions to identify multi-day directional opportunities and avoid entering against structural headwinds. The time frame changes how you use the information — not whether it's relevant.
How often should I check a macro trading dashboard?
At minimum, once before every trade you consider entering. In practice, most serious traders check their macro dashboard at the start of each session (to understand the current environment) and immediately before any entry (to confirm conditions haven't shifted). During high-impact news periods — central bank decisions, NFP, CPI — checking more frequently is warranted as conditions can shift significantly within a session.
Can a macro dashboard tell me when to buy or sell?
A macro dashboard surfaces conditions — it doesn't issue trade recommendations. It shows you the current directional bias, what's supporting or resisting price, and where institutional positioning sits. The trading decision remains entirely with you. Traders who want signals should look at signal services. Traders who want to understand the environment their trades exist inside should use a macro dashboard.